Experiment of The Month
Zeno and the Bouncing Ball
Zeno's motion paradoxes all have to do with dividing time into ever smaller slices. We can experimentally realized such a sequence of ever-smaller time intervals by watching a bouncing ball.
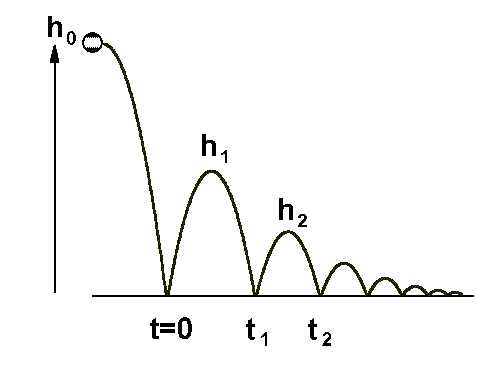
The figure at the right represents a ball dropped from an initial height h0 . When it bounces it loses energy, so that the next bounce height, h1 , is smaller. The model used here is that the fraction of energy lost on each bounce is a constant, independent of energy.
In the figure, the ball is given a small horizontal velocity to the right, so that it bounces further to the right each time. The horizontal position axis acts as a time axis because the horizontal velocity remains constant.
The model implies that each successive bounce is less than the previous bounce by the same fraction. In the figure, each bounce is half as high as the previous bounce. We call the fraction remaining g , so that
h1 = g h0 .
In classroom discussion, we consider another possibility; that the bounce decreases by a constant amount, rather than a constant fraction. This model readily predicts the number of bounces for the ball to come to rest. However, experiment (dropping the ball from several different heights) quickly shows that this model is not close to the ball's behavior. It is more accurate to say that the ball looses (for example) half of its height on the first bounce, no matter that the original height from which it was dropped.
With the constant fraction model, it seems that the ball will require an infinite number of bounces to come to rest. Intuition says that it will take an infinite amount of time for this to occur. Analysis however, shows that in this model, the ball can make an infinite number of bounces in a finite amount of time. The reason is that the time between bounces decreases as the bounce height decreases.
The idea that the ball executes an infinite number of bounces in a finite amount of time is perhaps the most interesting response to Zeno's paradoxes. We have experimental evidence that an infinite number of events can occur in a finite amount of time. Mathematically, we have use the fact that (for some cases) the sum of an infinite number of terms is a finite number.
Using the labels in the diagram, we show that the time from t=0 to t=t1 is given by
(t1 - 0) = (8h1/g)(1/2)
In words, the bounce-to-bounce time is proportional to the square root of the bounce height.
Using the fact that h2 = g h1, we see that
(t2 - t1) = (g8h1/g)(1/2) = (t1 - 0)(g)(1/2)
Adding up all the bounce-to-bounce times (from n=0 to infinity) gives the total time to come to rest:

With a (g)(1/2) defined as b, this becomes

and the sum has the result

We usually determine g by measuring the initial drop height and the first bounce height, h1 , so that the equation above is a natural way to express the time to come to rest. An alternative is to notice that the time between the first and the second bounces is just the first term in that expression, so that

From this point of view, b is best measured by measuring the time for the second bounce and the first for the second bounce: b is the ratio of those times. In this way, the time to come to rest is predicted from the times for the first two bounces.
In a later exercise, we consider the decay of the motion of a pendulum. To a good approximation, the pendulum also loses a constant fraction of its amplitude with each swing. The difference is that the period of the pendulum does not go to zero as the amplitude decreases - it remains nearly constant. Because of this the model predicts an infinite numbers of swings occur before the pendulum comes to rest. This behavior manifests itself in the (approximately) exponential decay of the pendulum amplitude.
